
Every number with evidence, live for your team.
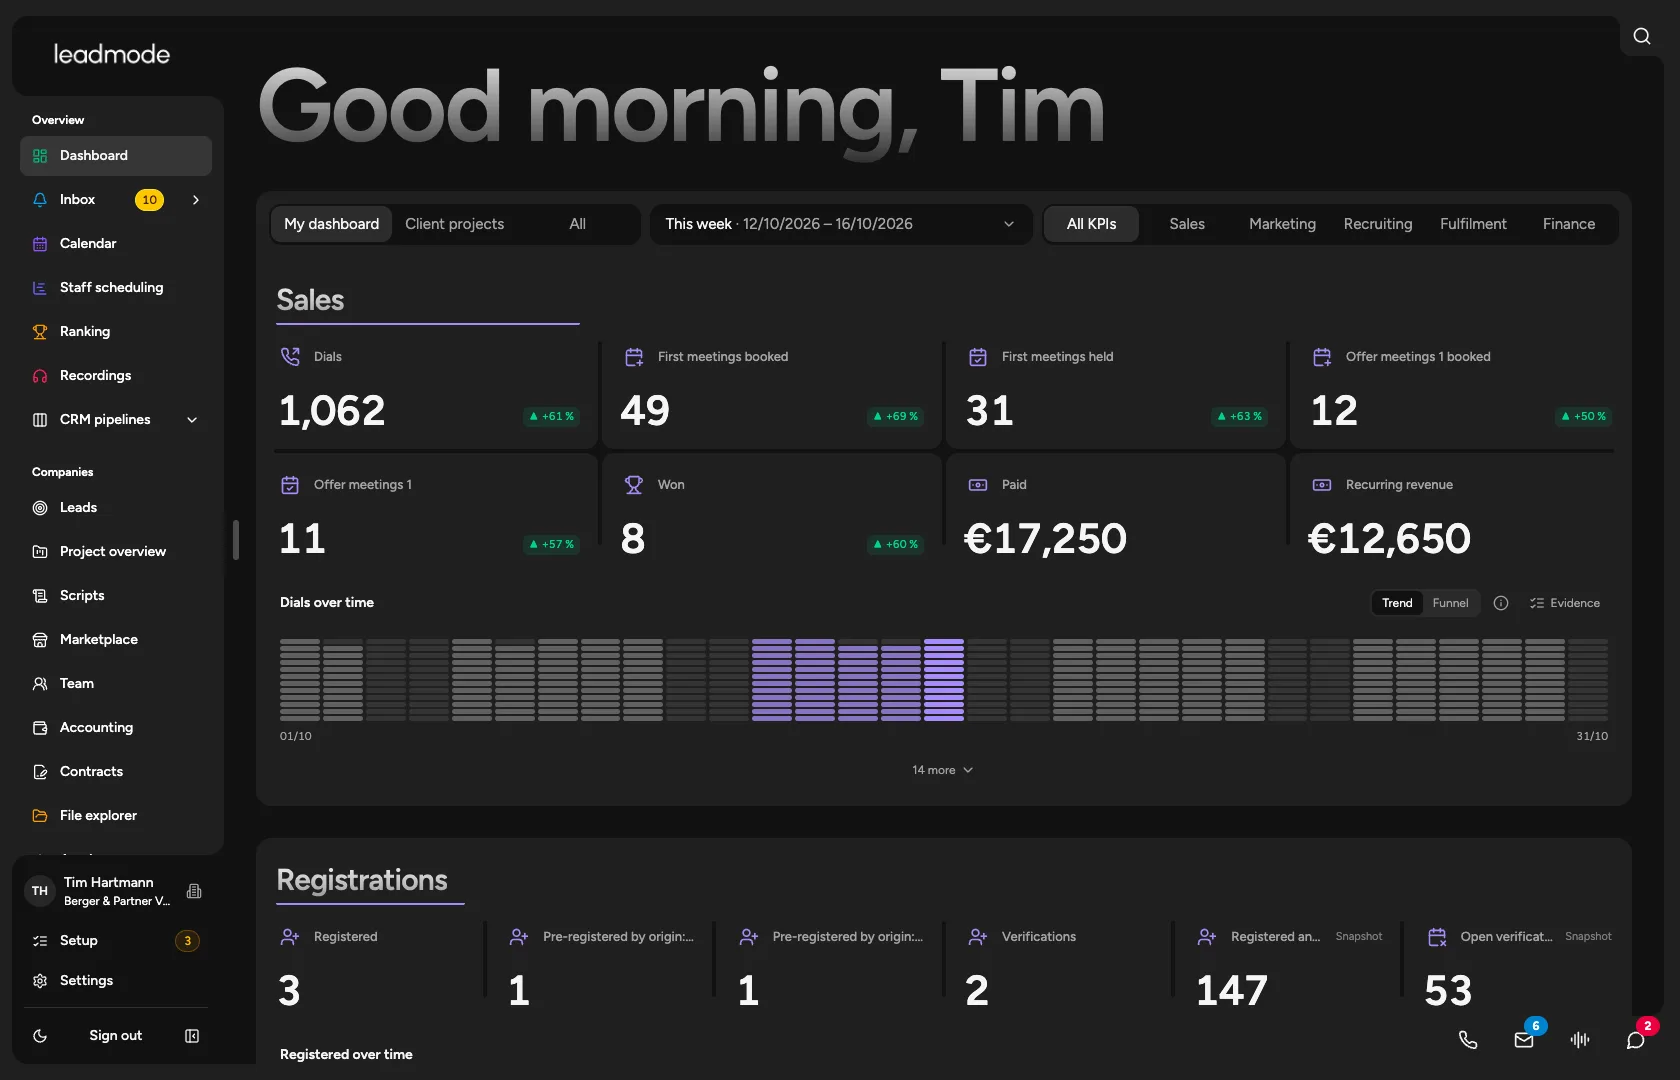
One dashboard for sales, marketing, recruiting, fulfilment and finance, plus a ranking for your callers. Every metric shows numerator and denominator, and one click opens the cases behind it.
Sound familiar?
The numbers sit in Excel, in the phone system and in the CRM, and none of them matches the others.
A rate without a denominator and without evidence can’t be checked by anyone, and a missing source quietly turns into zero.
How Leadmode solves it.
Five areas
Sales, marketing, recruiting, fulfilment and finance read the same query, so switching loads nothing new. Marketing, recruiting, fulfilment and finance show only what has evidence behind it.
Filters and periods
Period by quick pick (today, 7 days, 30 days, month) or free choice, plus project, employee, stage and source. Your settings are kept when you come back from a lead.
Phone metrics
Dials, reached, gatekeepers, decision makers, first calls, appointment rate and show rate, plus won opportunities and evidenced order value. The counting rules live in one place in the code and apply to the dashboard, the weekly report and the apps.
Evidence instead of claims
Every number shows numerator, denominator and the cases behind it. If the basis is missing, it says ‘cannot be calculated’ with the reason, never an invented zero.
Three ways to measure
In the period, by cohort or as of a cut-off date. Later corrections never change an earlier cut-off date, and the period can be compared with the one before.
Source: cold, warm, website
Every lead has exactly one source class. The dashboard sets them side by side and shows, per class, inflow, dials, reach, appointment rate and bad data.
Ranking with your standing
Leaderboard and podium by appointments, dials, decision makers, conversations or won, by period, project and view (clients or own sales). Your place, the gap to the next and your rates appear alongside, and the ranking updates with new calls and appointments.
Quota and breakdown
In the fulfilment area you see the current month’s quota with target and delivered. Every metric can be broken down by project and employee, and outcomes and objections appear as bars.